Data set structure
The data set structure contains for each subject measurements, dose regimen, covariates etc … i.e. all collected information. The data must be in the long format, i.e each line corresponds to one individual and one time point. Different type of information (dose, observation, covariate, etc) are recorded in different columns, which must be tagged with a column type (see below). The column types are very similar and compatible with the structure used by the Nonmem software (the differences are listed here). This is specified when the user defines each column type in the data set as in the following picture.
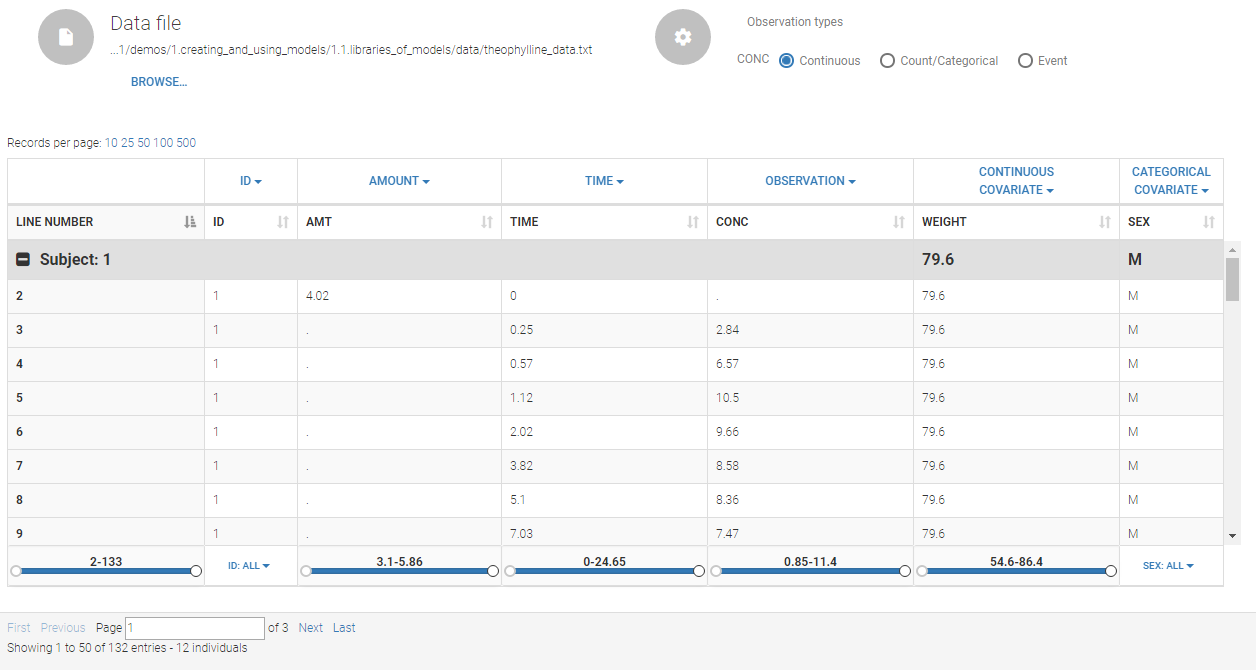 Notice that Monolix often provides an initial guess of the type of the column depending on the name.
In addition, we have a button DATA VIEWER that allows to explore the data set as Datxplore.
Description of column-types
The first line of the data set must be a header line, defining the names of the columns. The columns names are completely free. In the MonolixSuite applications, when defining the data, the user will be asked to assign each column to a column-type (see here for an example of this step). The column type will indicate to the application how to interpret the information in that column. The available column types are given below:
Column-types used for all types of lines:
- ID (mandatory): identifier of the individual
- OCCASION (formerly OCC): identifier (index) of the occasion
- TIME: time of the dose or observation record
- DATE/DAT1/DAT2/DAT3: date of the dose or observation record, to be used in combination with the TIME column
- EVENT ID (formerly EVID): identifier to indicate if the line is a dose-line or a response-line
- IGNORED OBSERVATION (formerly MDV): identifier to ignore the OBSERVATION information of that line
- IGNORED LINE (from 2019 version): identifier to ignore all the information of that line
- CONTINUOUS COVARIATE (formerly COV): continuous covariates (which can take values on a continuous scale)
- CATEGORICAL COVARIATE (formerly CAT): categorical covariate (which can only take a finite number of values)
- REGRESSOR (formerly X): defines a regression variable, i.e a variable that can be used in the structural model (used e.g for time-varying covariates)
- IGNORE: ignores the information of that column for all lines
Column-types used for response-lines:
- OBSERVATION (mandatory, formerly Y): records the measurement/observation for continuous, count, categorical or time-to-event data
- OBSERVATION ID (formerly YTYPE): identifier for the observation type (to distinguish different types of observations, e.g PK and PD)
- CENSORING (formerly CENS): marks censored data, below the lower limit or above the upper limit of quantification
- LIMIT: upper or lower boundary for the censoring interval in case of CENSORING column
Column-types used for dose-lines:
- AMOUNT (formerly AMT): dose amount
- ADMINISTRATION ID (formerly ADM): identifier for the type of dose (given via different routes for instance)
- INFUSION RATE (formerly RATE): rate of the dose administration (used in particular for infusions)
- INFUSION DURATION (formerly TINF): duration of the dose administration (used in particular for infusions)
- ADDITIONAL DOSES (formerly ADDL): number of doses to add in addition to the defined dose, at intervals INTERDOSE INTERVAL
- INTERDOSE INTERVAL (formerly II): interdose interval for doses added using ADDITIONAL DOSES or STEADY-STATE column types
- STEADY STATE (formerly SS): marks that steady-state has been achieved, and will add a predefined number of doses before the actual dose, at interval INTERDOSE INTERVAL, in order to achieve steady-state
Loading a new data set
To load a new data set, you have to go to “Browse” your data set (green frame), tag all the columns (purple frame), define the observation types, and click on the blue button ACCEPT as on the following.
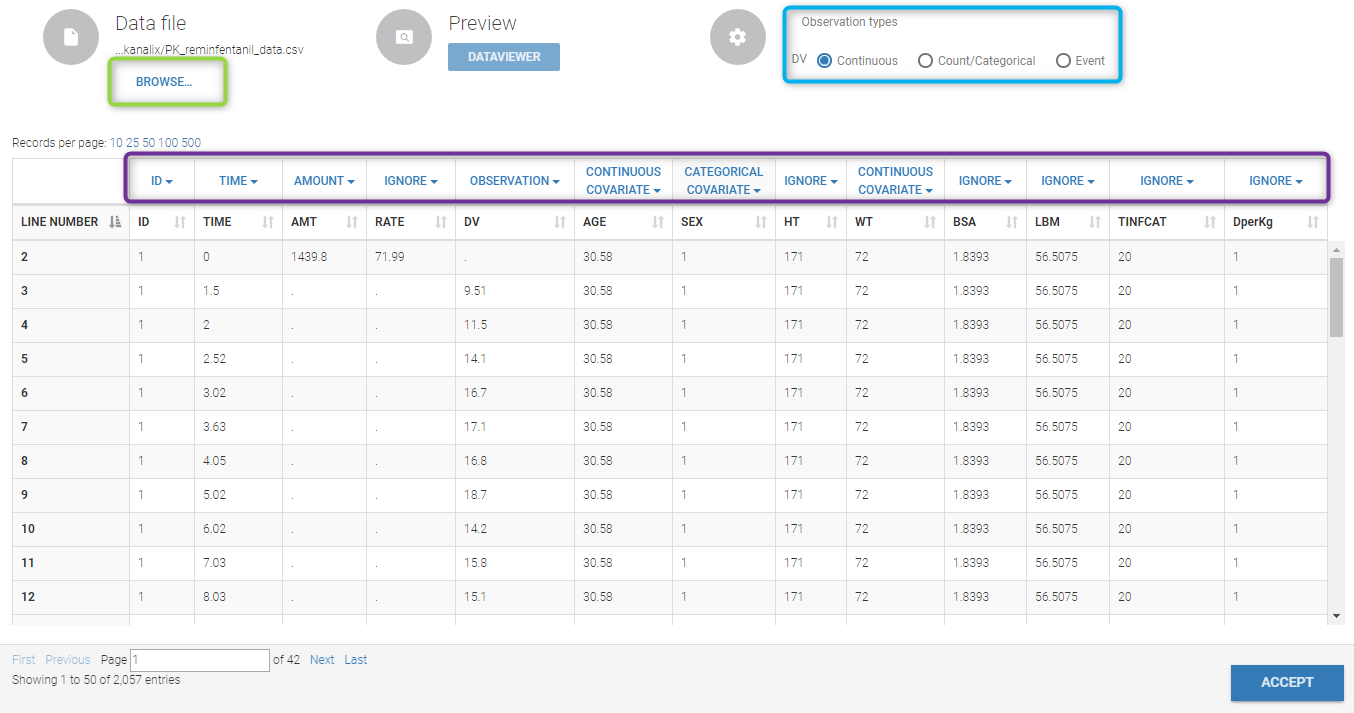
Observation type
There are three types of observations
- continuous: The observation is continuous with respect to time. For example, a concentration is a continuous observation.
- count/categorical: The observation values takes place in a finite categorical space. For example, the observation can be a categorical observation (an effect can be observed as low, medium, high) or a count observation over a defined time (the number of epileptic crisis in a defined time).
- event: The observation is an event, for example the occurring of an epileptic crisis.
The type of observations can be specified by the user in the interface.
Labeling
The name proposed in the figure and in the data choice is the one defined in the label. The user can modify it. By default, the label used is the one defined in the data set.
Starting from the 2019 version, it is possible to change your preferences. By clicking on Settings>Preferences, the following windows pops up.
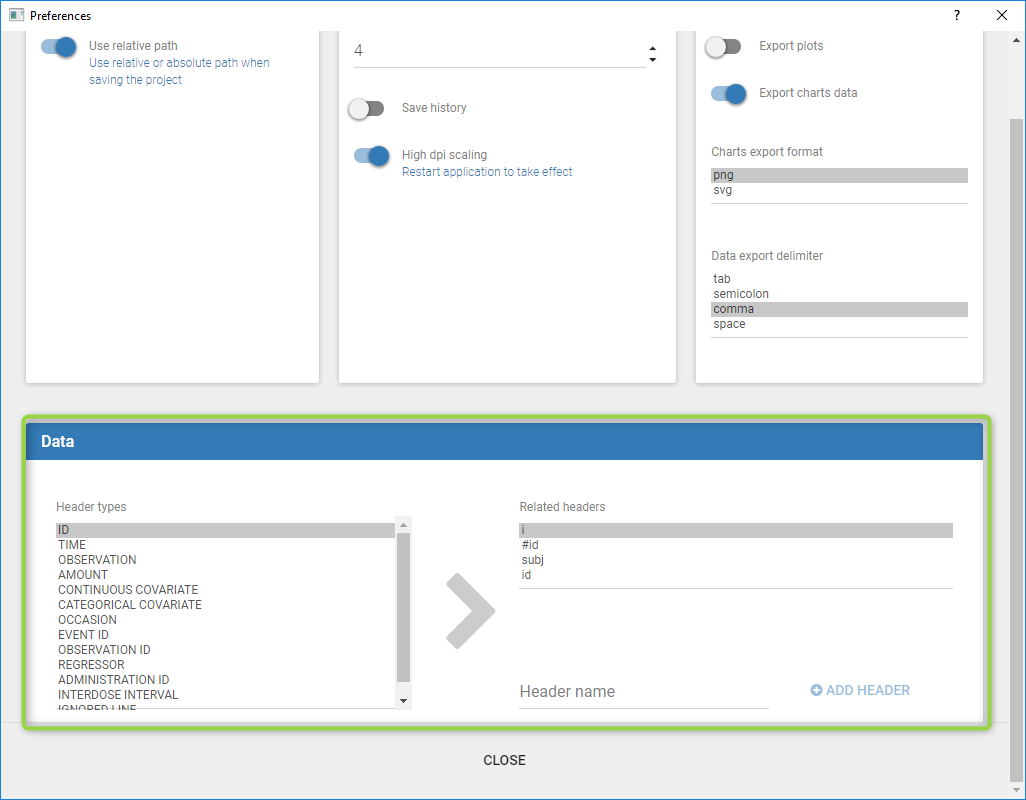
In the DATA frame, you can add or remove preferences for each column.
To remove a preference, double-click on the preference you would like to remove. A confirmation window will be proposed.
To add a preference, click on the header type you consider, add a name in the header name and click on “ADD HEADER” as on the following figure.
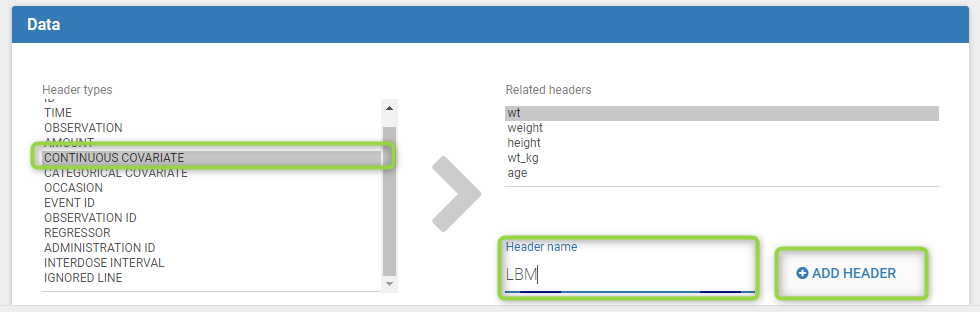
Notice that all the preferences are shared between Monolix, Datxplore, and PKanalix.
Filtering
Starting from the 2020 version, we added the possibility to filter the data set as can be seen here.