Version 2024
This documentation is for Datxplore starting from 2018 version.
©Lixoft
Purpose
Datxplore is a graphical and interactive software for the exploration and visualization of data. Data set under consideration are for population modeling as defined here. Datxplore provides various plots and graphics (box plots, histograms, survival curves…) to study the statistical properties of discrete and continuous data, and to analyze the behavior depending on covariates, individuals, etc. It can be used to
- See the PK dynamics over time with the possibility of display in log-scale.
- See if there are outliers.
- See the PD versus the PK.
- Split, color and filter the data set to see the dependency of the outcome w.r.t. the covariates.
- See a covariate with respect to another covariate and see the correlation.
Notice that starting from the 2019 version, it is possible to export the Datxplore project to Monolix.
Layout
The graphical interface comprises three main parts. A HOME frame, a Data frame to manage your data set and a frame to explore the data set.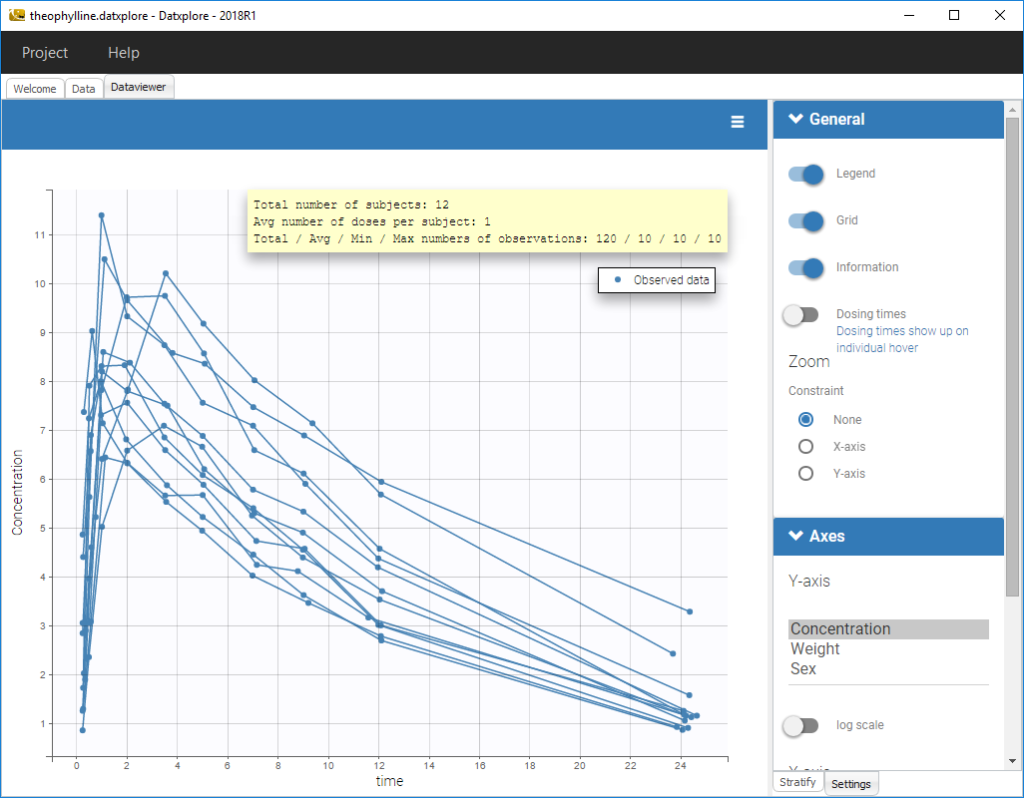
Data selection
The applicable datasets are those dedicated to population modeling. The population approach describes phenomena observed in a set of individuals and the variability between individuals. The data is thus individual data, and is often longitudinal (over time). For each subject, the dataset contains measurements, the dose regimen, covariates, etc., i.e. all collected information.
The first thing to do is to choose a dataset and tag the columns according to the column-types defined here.
Supported file types: Supported file types include .txt, .csv, and .tsv files. Starting with version 2024, additional Excel and SAS file types are supported: .xls, .xlsx, .sas2bdat, and .xpt files in addition to .txt, .csv, and .tsv files.
Data manipulation
Used to select, filter or split data. See Data manipulation section.
Data visualization
In the Dataviewer frame, the user can see all the possible figures. See Data visualization section.